Welcome to the latest edition of The Data Month.
This month, ahead of the Q3 earnings from the major US online operators, the team at Deutsche Bank takes a look at what the state-by-state data tells us about what happened in the third quarter.
Meanwhile, more analysis from the state-by-state data for September shows the start of the NFL and College bowl season provided a handle and GGR boost, both in absolute terms and when looked at on a same-store basis.
Weak as I am, no tears for you.
Trend spotting
Deutsche Bank looks at the ‘reality’ of the Q3 OSB backdrop.
The underlying state-by-state data points to a weaker Q3 OSB performance than might have been expected, with promo spend in states where it can be tracked still on the rise and NGR lagging GGR also in these trackable states, according to the analyst team at Deutsche Bank.
Looking at the data ex-the tailwinds provided by recent launches, including Kansas, Massachusetts, Kentucky, Ohio and Maryland online, the DB team suggests same-store growth in low single-digits.
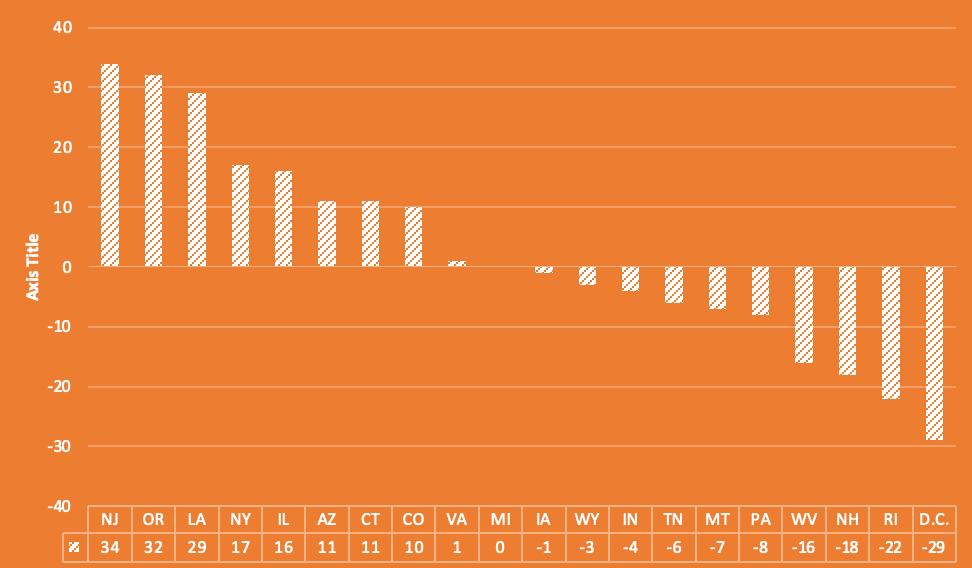
🇺🇲 Q3 OSB GGR YoY % change by state
Source: Deutsche Bank, state gaming commissions
Hotter than July: The Q3 strength can be attributed to a strong July where GGR across the mature states was up 27% YoY vs. 2.3% growth in August and 6.9% in September. But the DB team points out that when the outsized contributions from New Jersey and New York are excluded the picture worsens.
By this calculation, July GGR is up 20.9% YoY whereas it falls by 6.8% in August and by 3.4% in September.
There are two further nuances in the data, the DB team says. First, there is a clear split between markets where there is an open commercial market vs. those states with a dominant state-run entity. As can be seen, the latter perform.
On the left hand side of the chart lie New Jersey, New York, Illinois, Arizona and Colorado.
On the right hand side are Washington DC (on -29%), Rhode Island (-22%) and New Hampshire (-18%).
** SPONSOR’S MESSAGE ** EveryMatrix delivers iGaming software, solutions, content and services for casino, sports betting, payments, and affiliate/agent management to 200+ global Tier-1 operators and newer brands. The platform is modular, scalable, and compliant, allowing operators to choose the optimal solution depending on their needs.
EveryMatrix empowers clients to unleash bold ideas and deliver outstanding player experiences in regulated markets.
The promo effect
To promo or not to promo: The other nuance is potentially more telling. That is the split identified by Deutsche Bank between the four states where promo spend is notified to the regulator (Pennsylvania, Michigan, Connecticut and Arizona) vs. the states in which no promotional spend information is provided.
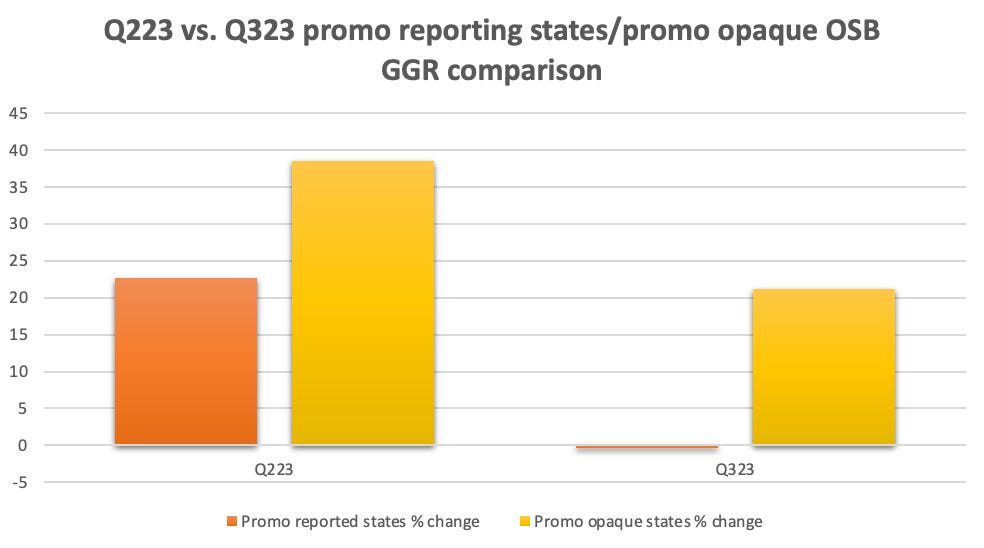
The obvious conclusion from the difference between the two cohorts – the promo four vs. a sample of four promo-opaque states, including New Jersey, New York, Illinois and Colorado – is that GGR within the latter group is still being inflated by promos.
In Q3 the promo-opaque GGR rise was 21% vs. a 0.3% decline in the promo four.
Source: Deutsche Bank and state gaming commissions
The team notes it should be borne in mind that Q3 is generally a period when promos as a percentage of handle is seasonally high due to the start of the NFL season in September. But the team adds, when looking at the promo four, “one would struggle to explain that promotional spend is down YoY, as the narrative goes”.
“Largely mature states are not showing a reduction in promotional spend,” they add.
Indeed, in the promo four it can be seen that aggregate promotional spend is up 7.6% YoY in Q323, which is akin to the increase in Q223.
The only state that bucks the trend is Michigan.
They also note that GGR in these four states is down 30% YoY after growing 23% in Q223, albeit largely due to lapping high hold percentages.
💵 Promo spending still on the rise
Increases are also evident when promos are looked at as a percentage of handle. Here it can more clearly be seen that the goal of promo spend in any way reversing as states mature is illusory, at least to date.
🎯 Promo spend as a percentage of handle remains constant
The Deutsche Bank team says that, tying together the Q323 GGR figures with the promo spend, the net OSB revenue is down YoY by 4% vs. a flat outcome the year previous. In Pennsylvania and Connecticut, they note, while promo spend was up, NGR is still lagging GGR.
Wood for the trees: The team points out that other trends are likely to be evident when it comes to the Q3 reports of the major OSB operators, including market share dynamics (i.e. DraftKings appearing to replace FanDuel at the head of the market), continued strength in iCasino and expense reduction efforts.
“Thus, despite the current industry data, we are not making a call that Q323 operator results will be challenged, but merely providing the reality of the OSB industry backdrop,” the team adds.
** SPONSOR’S MESSAGE ** The 2023 edition of the American Gambling Awards is pleased to announce the full list of 11 winners recognized for their leadership and innovation within the regulated, online U.S. gambling industry. The American Gambling Awards is produced by Gambling.com Group (Nasdaq: GAMB), a leading performance marketing company for the regulated global online gambling industry.
The Group champions the development of a responsibly regulated, competitive online gambling market in the U.S. and the Awards help bring positive attention to the leaders making this a reality.
Recent analyst takes
On the bright side: A more positive view of recent OSB activity comes from the team at Jefferies who noted that in the 11 states to have reported in September so far, handle rose 46% YoY and was 34% up on a same-store basis. However, GGR was up a more modest 16% YoY and with an even more modest 6% same-store increase.
Still got it: The Jefferies team noted that in September to date FanDuel leads with 41% (from 10 of those states), followed by DraftKings (40% from 11 states) and BetMGM (7% from eight states).
This compares with August where, as the team at EKG said just last week, DraftKings led the way across both OSB and iCasino.
But, as the Jefferies team noted, the trajectories of the top two in terms of YoY GGR increases are very different.
While FanDuel rose 11% YoY, DraftKings was up by 40% in the states where it is live.
Keeping up with the Joneses: Referring to the increase in promo spend in Pennsylvania, the team at Jefferies said the increase is almost wholly down to DraftKings doubling its promo spend YoY to $11.5m in order to more than match FanDuel, which laid out $11.1m, representing a 3% YoY increase.
The hold: A key factor in the upcoming Q3 earnings will be the OSB hold in the past three months, which the team at Macquarie estimates came in at 9.5%, which they pointed out is “slightly above” their new normalized hold target of 9%,
But the team added that they “still expect hold to act as a ~100bps headwind for most operators” compared to last year.
“Overall, we expect Q4 will be a much bigger catalyst for the sector given our expectation for record profits and therefore we view any pullback as a buying opportunity.
** SPONSOR’S MESSAGE ** BettingJobs is the global leading recruitment solutions provider to the iGaming, Sports Betting and Lotteries sectors. Boasting a 20-year track record supporting the iGaming industry, and with a team of experts and world class knowledge, it’s no surprise BettingJobs is experiencing rapid growth with outstanding results. Does your company have plans to expand teams to cope with strong growth and demand?
Contact BettingJobs.com today where their dedicated team members will help you find exactly what you are looking for.
Calendar
Oct 24: Boyd Gaming
Oct 25: Churchill Downs (e), VICI (e)
Oct 26: Betsson, Evolution, Churchill Downs (call), VICI (call), GLP (e)
Oct 27: GLP (call)
An +More Media publication.
For sponsorship inquiries email scott@andmore.media.


