FanDuel’s OSB grip begins to loosen
Has DraftKings overtaken FanDuel in OSB? Plus, Propus Partners on English Premier League pricing +More
Good morning. Welcome to the August edition of the Data Month.
Kicking off this month, we take a look at the latest data for OSB across the major states and assess whether a change at the very top offers any hope for those hoping to grab market share.
Next up, we have the latest from Propus Partners. This month, the team takes a look at what was on offer for the start of the soccer season and finds a huge degree of uniformity of pricing globally.
Finally, we have the latest datalines.
Let me see you one, two step (here we go).
Change at the top
The latest data suggests DraftKings has overtaken FanDuel as the market leader in OSB, at least as measured by handle.
Handing over the baton: Across a selection of the biggest sports-betting states, the data from July suggested DraftKings has overtaken rival FanDuel as the market leader by handle for the first time.
Analysts from Truist noted that in states where handle and GGR market shares are disclosed (which Truist tallies at 11), DraftKings – with 37.3% – led by handle for the first time since it began its tracking. FanDuel was on 35.4%.
But the data for July suggested the pendulum might have swung back in FanDuel’s favor. Truist said the data it has available for the month showed FanDuel was back up to 37.1% vs. DraftKings’ 36.6%.
The team noted that in the YTD, FanDuel led with 37.8% vs DraftKings 34.1%.
By Deutsche Bank’s calculations, in July DraftKings saw its GGR market share from the majority of OSB states rise to 35.1% (from a LTM figure of 28.9%).
At the same time, the FanDuel percentage figure had fallen from 45% LTM to 38.9% in July.
Pole position: There is clear evidence at state level that DraftKings had caught up to FanDuel, and overtaken it in some states, in recent months. Indeed, as E+M noted previously, in DraftKings’ home state of Massachusetts, the company had leapt to an immediate strong GGR lead of 50% (as of July) vs. FanDuel’s 30%.
New York, meanwhile, has been identified as one such crossover example. The latest monthly data for July showed that by GGR the two were neck and neck at $41m.
🏇 Dead heat: FanDuel and DraftKings NY GGR Aug22-Jul23
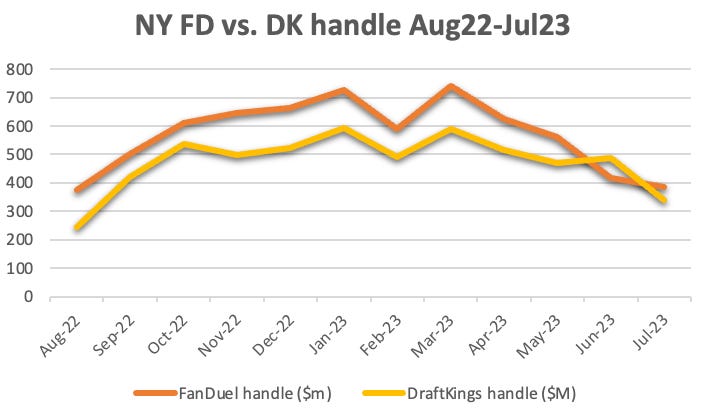
The picture is slightly more complicated when looked at via handle. Here it can be seen that while DraftKings did indeed overtake its rival in June, the positions once again reversed in July with FanDuel generating $385m to DraftKings’ $340m.
✂ Scissor sisters: DraftKings and FanDuel switch positions in NY by handle
** SPONSOR’S MESSAGE ** BettingJobs is the global leading recruitment solutions provider to the iGaming, Sports Betting and Lotteries sectors. Boasting a 20-year track record supporting the iGaming industry, and with a team of experts and world class knowledge, it’s no surprise BettingJobs is experiencing rapid growth with outstanding results. Does your company have plans to expand teams to cope with strong growth and demand?
Contact BettingJobs.com today where their dedicated team members will help you find exactly what you are looking for.
Closing the gap
Gap store: The picture of DraftKings and FanDuel in a much closer race than was previously the case was repeated elsewhere. In New Jersey, for instance, according to the analysts at Wells Fargo, the market share race between the top two in the market had certainly closed over the course of the past year.
🪴Garden state rivals
Convergence: A similar pattern of the two converging emerged in Pennsylvania when looking at the NGR numbers for the past 12 months.
🔑 Same-same but different: the two are also entwined in Pennsylvania
Mi oh mi: And in Michigan where, although there was still a sizable gap in GGR between the two, it was not as large as it once was.
🚗 Less clear blue water in Michigan
Two horse race
The race: Clearly, the top spot across many states is now up for grabs in a way that it wasn’t previously when FanDuel was racking up 50%+ OSB GGR market shares in state after state. Much has been made – not least by the company itself – of DraftKings being more competitive in terms of product and pricing.
One caveat is that this was happening at the absolute low point in the sporting calendar.
While last summer FanDuel said it would be “leaning into’ its leading market positions during the summer, it wasn't obvious it was doing the same this time around.
The door ajar? The other question is whether the closing of the gap between the top two companies means anything for operators such as Penn/ESPN Bet, Fanatics and bet365 hoping to grab some market share in the coming months.
The bad news from their collective point of view is that the rejigging at the very top did nothing to alter the duopolistic dominance.
The data from Deutsche Bank showed that the combined share between the two in July comes in at 74%; in comparison, the last 12 months figures stands at 73.9%.
Further reading: E+M’s recent Quarter in Review looked at the profit prospects of FanDuel and DraftKings as both contemplate potential for $1bn in adj. EBITDA by 2025. Meanwhile, a familiar duopoly emerges in iCasino.
** SPONSOR’S MESSAGE ** ARE YOU READY FOR SOME FOOTBALL!?!? Now that you've had a month to figure out how you're spending $100K, we at Inside the Pocket invite you, your company, and your network to join our Pro Football Survivor game. Go to itpsurvivor.io to play our quick, easy, and fun Survivor game for the chance to win $50,000 for the winner and $50,000 for the winner's charity of choice. Pro football experts and novices alike will love a shot at this!
This exciting game is industry-focused, and everyone from the gaming space to agencies, brands, and teams and leagues is encouraged to join and share the fun.
Inside the Pocket and its 25+ content partners can bring you all sorts of engaging content from every game type to engage and convert your customers and prospects.
Enjoy!
Overround analysis
Propus Partners takes a look at the odds offered for the first round of matches from the English Premier League opening weekend.
A large number: Taking a look at industry pricing globally for the 10 matches from the opening round of the EPL in the middle of August, the team at Propus Partners said the data showed a large degree of uniformity over the 1,240 sites surveyed across 80 countries.
Looking at the 1x2 match winner markets, the analysts found over 92% of the 37,200 prices checked were within 10% of the global average (price excluding stake).
The team also found only 823 instances (~2%) of prices being offered that were greater than those on betting exchanges, suggesting a general acceptance that the global true price is generally correct.
The analysts found, however, a significant range in how much margin is applied, which they suggested is driven by levels of competition therefore customer choice, customer expectations and taxation
The long list showed a number of African countries ranking as those with the lowest average margins whereas a number of monopolies were at the other end of the list.
But Propus also found that margin is not applied equally, with more applied on low probability selections and less on high probabilities.
Overround comparison: Despite the overround being a “fairly blunt instrument” to measure margin, the team added, it does provide a fair comparison across different bookmakers in a sample.
A number of African and Central/Eastern European countries topped the list with averages around 1.03 to 1.04.
State monopolies and jurisdictions with turnover taxes are those positioned as the least competitive within the study.
Mature jurisdictions with a large number of licensed bookmakers, such as the UK, Ireland, Sweden and Denmark, have a wide range with some bookmakers aiming to compete on price, and others competing elsewhere (brand, product, promotions).
Not all selections are treated equally. It is well known on trading floors, but possibly less understood elsewhere, that different levels of margin are applied, often formulaically, at different ends of the probability spectrum.
Return to player: The three charts below are examples of the finding that in every region quite a bit more margin is proportionally applied to low probability (high price) selections, than it is on high probability (low price) ones.
🇪🇺 Europe return to player
🇺🇲+ 🇨🇦North America return to player
Africa return to player
The actual RTP percentages are slightly different by region, but on average, low probability selections gave an 80% RTP and those in the 0.5-0.8 probability range, where a high proportion of turnover is typically focused, gave ~95% RTP.
Anything over the 100% line on the y-axis would be considered an ‘arb’. It is clear from these charts quite how few there are. Of those that do exist, there is a slight skew to both shorter odds, and popular teams, suggesting this may have been done for competitive reasons.
** SPONSOR’S MESSAGE ** Venture capital firm Yolo Investments manages in excess of €600m in capital across 80 exciting fintech, gaming and blockchain companies. The Yolo Investments' Gaming fund, regulated by the Guernsey Financial Services Commission, has taken positions in fast-growth suppliers and operators, including Dabble and Enteractive.
Yolo Investments (yolo.io) wants to hear from readers of this newsletter. Get in touch with your pitch, or for a chat about innovative products which can plug into our investment ecosystem.
Datalines
AGA: Online revenue was worth 23% of total gaming revenue in Q2, according to the American Gaming Association.
An +More Media publication.
For sponsorship inquiries email scott@andmore.media.


June / July - baseball only; lowest handle months overall; overweighted to the higher staking, lower margin play that DK weights towards.... dont be surprised to see this reverse to the norm in the Fall